Dashboard
The MagicBlocks Dashboard provides a real-time snapshot of how well your AI Agent is performing. With key metrics, analytics, and session insights, you can track engagement, optimize interactions, and drive better sales outcomes. Let’s explore the new UI and how you can use it effectively.
Key Metrics and What They Mean
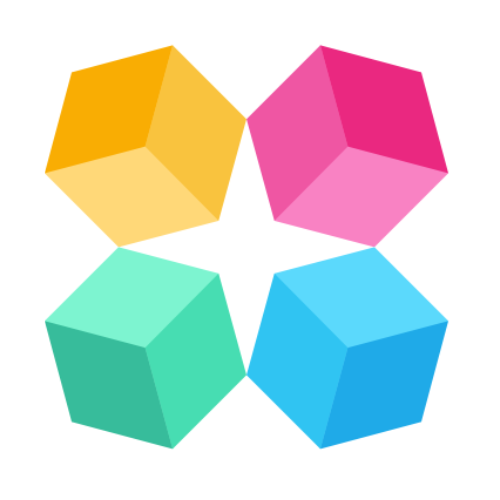
The top section of your dashboard displays the most important performance metrics at a glance:
Sessions – Total number of interactions initiated with your AI.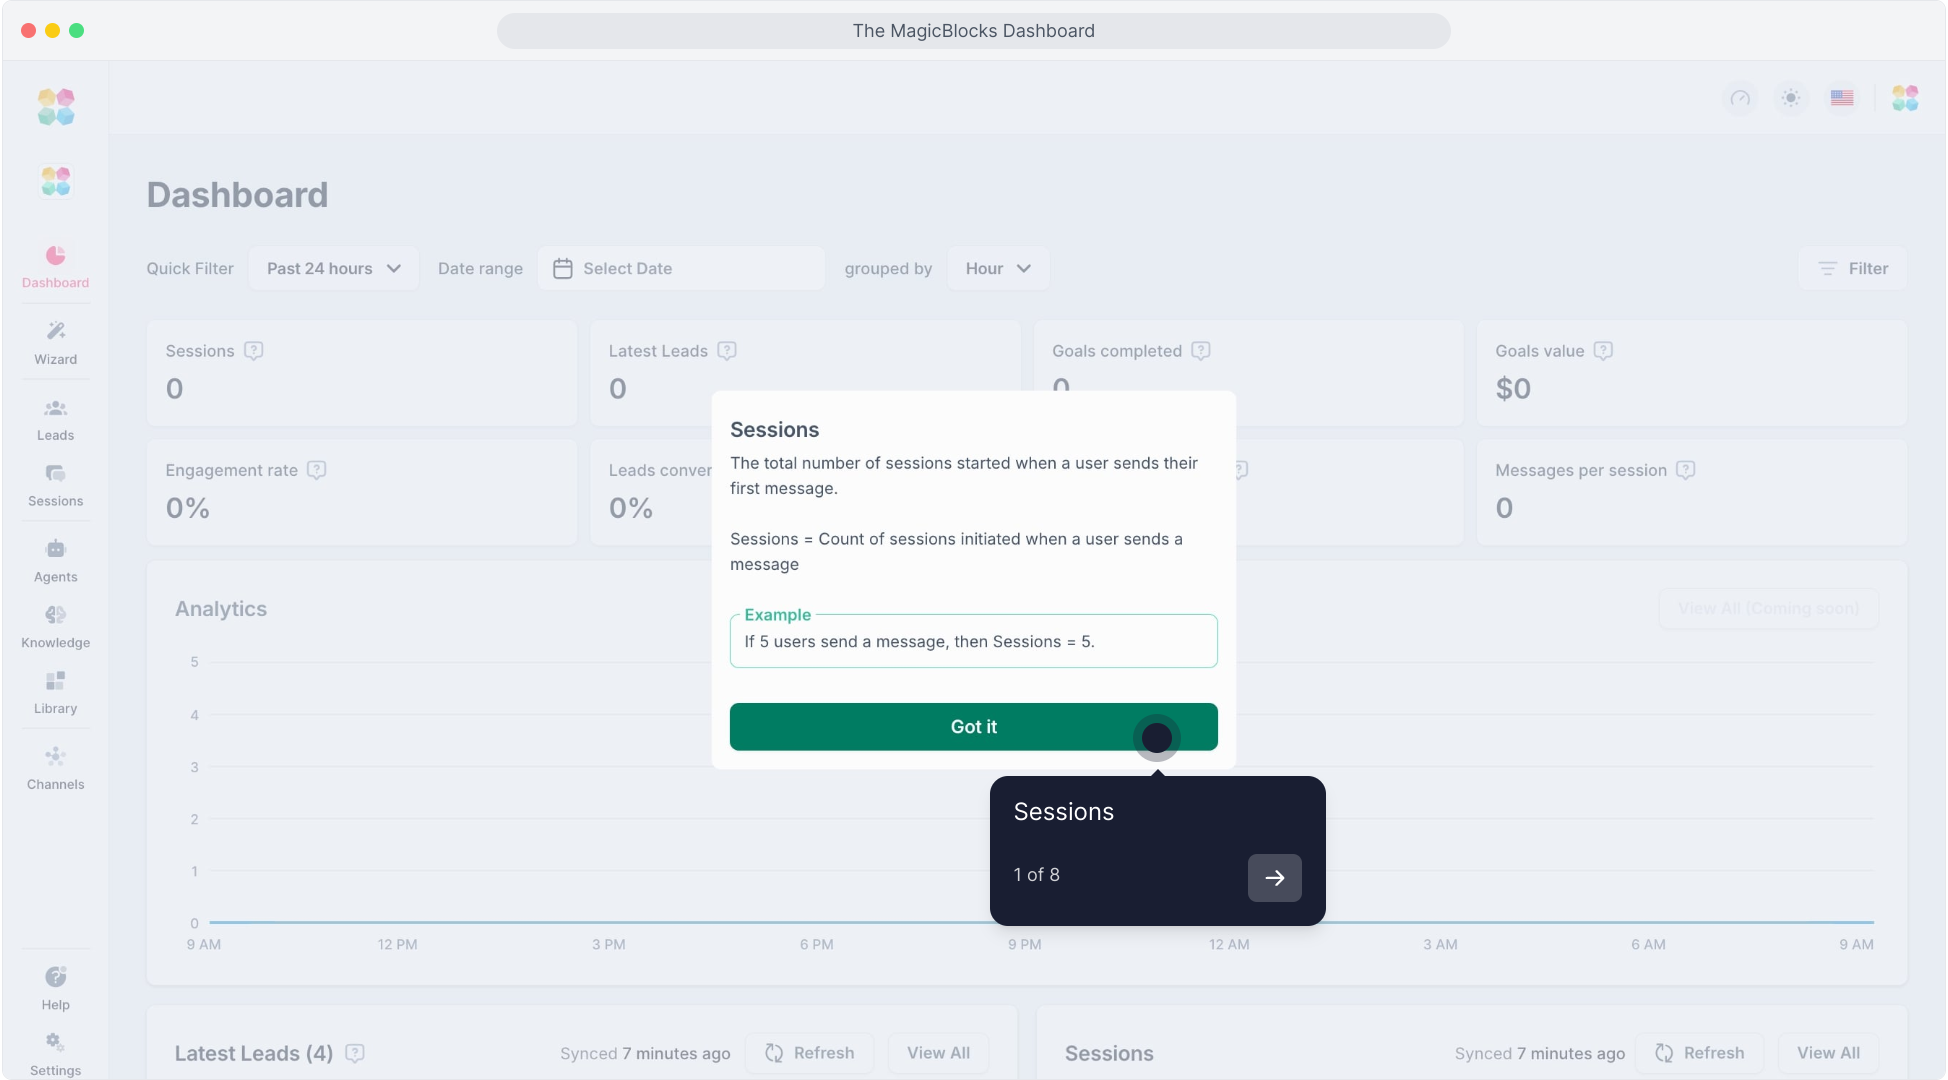
Latest Contacts – The number of newly generated contacts that include contact details and are contactable. A higher count signals increased reach and engagement.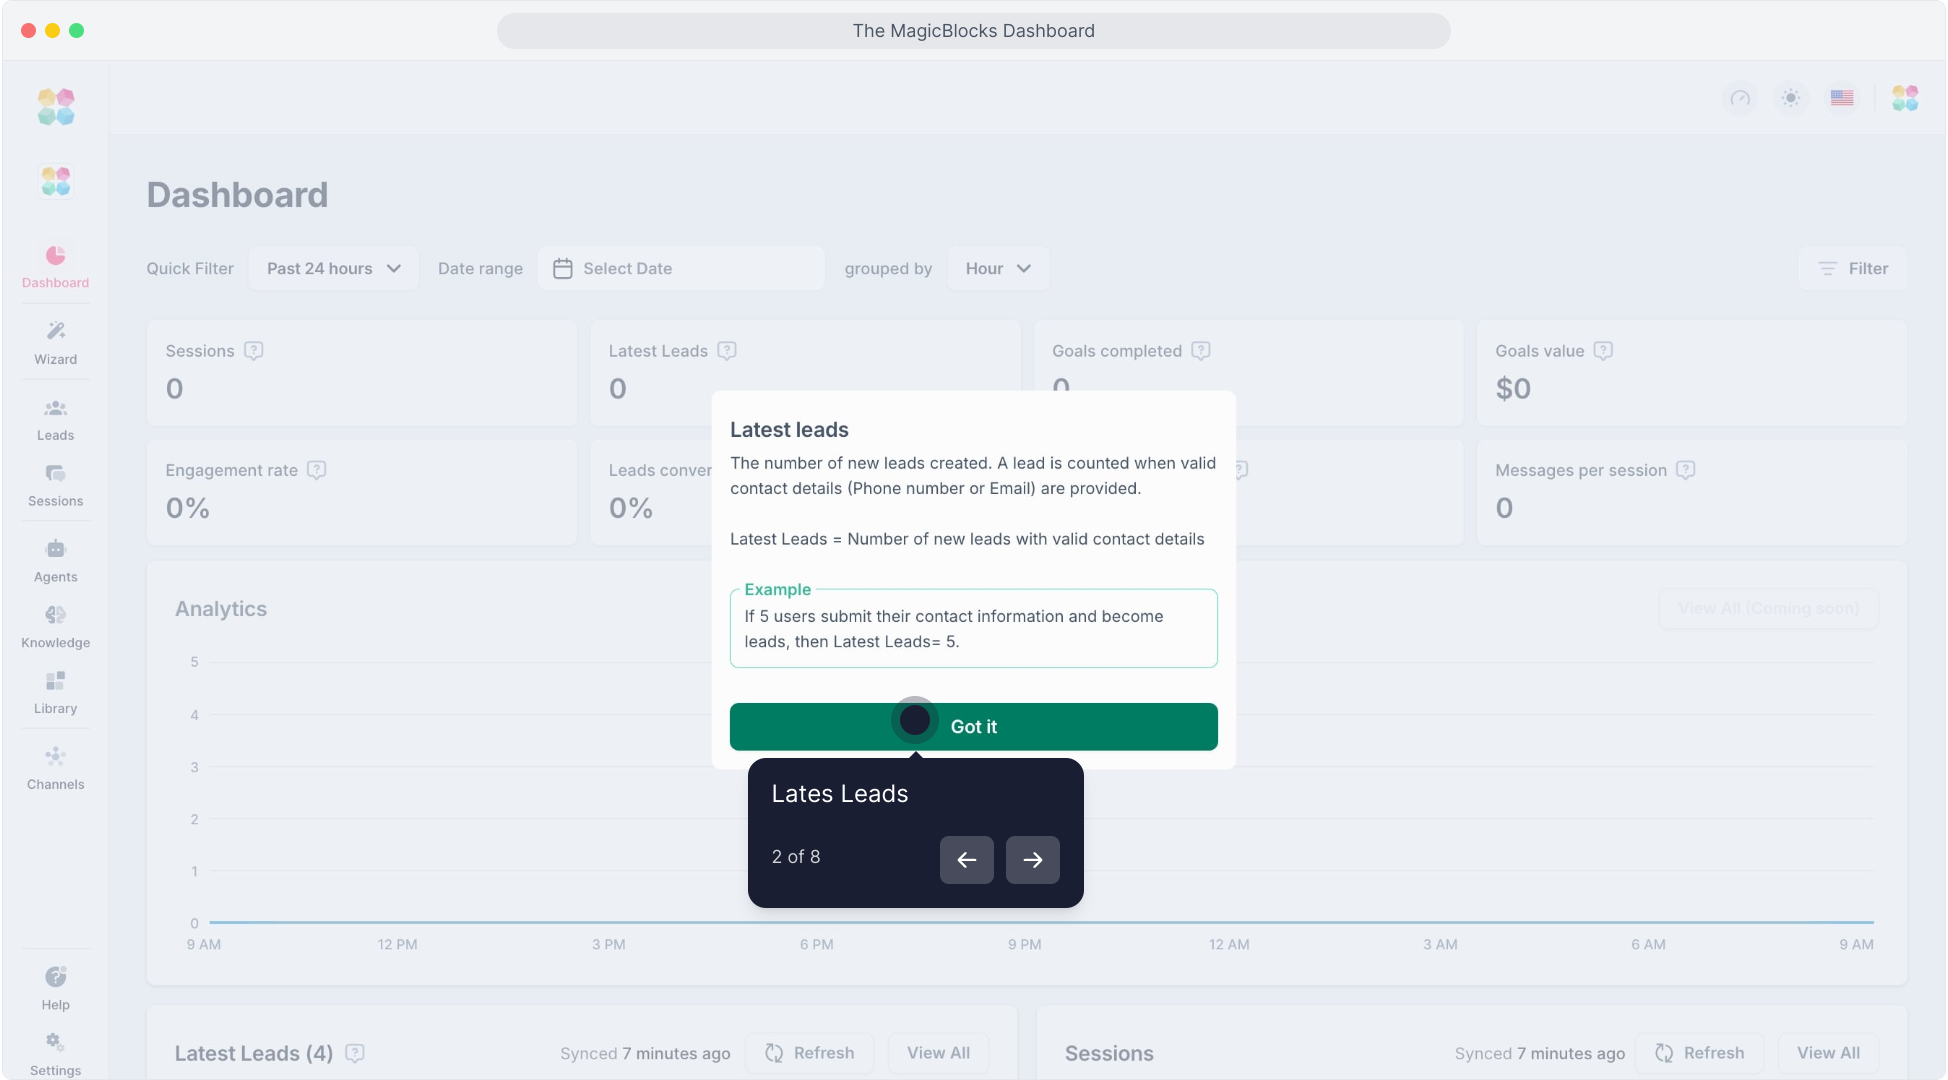
Engagement Rate – The percentage of sessions where users actively engage with your AI. A strong engagement rate indicates that your AI is delivering valuable interactions.
Messages Per Session – The total number of messages exchanged between users and the AI, reflecting interaction depth.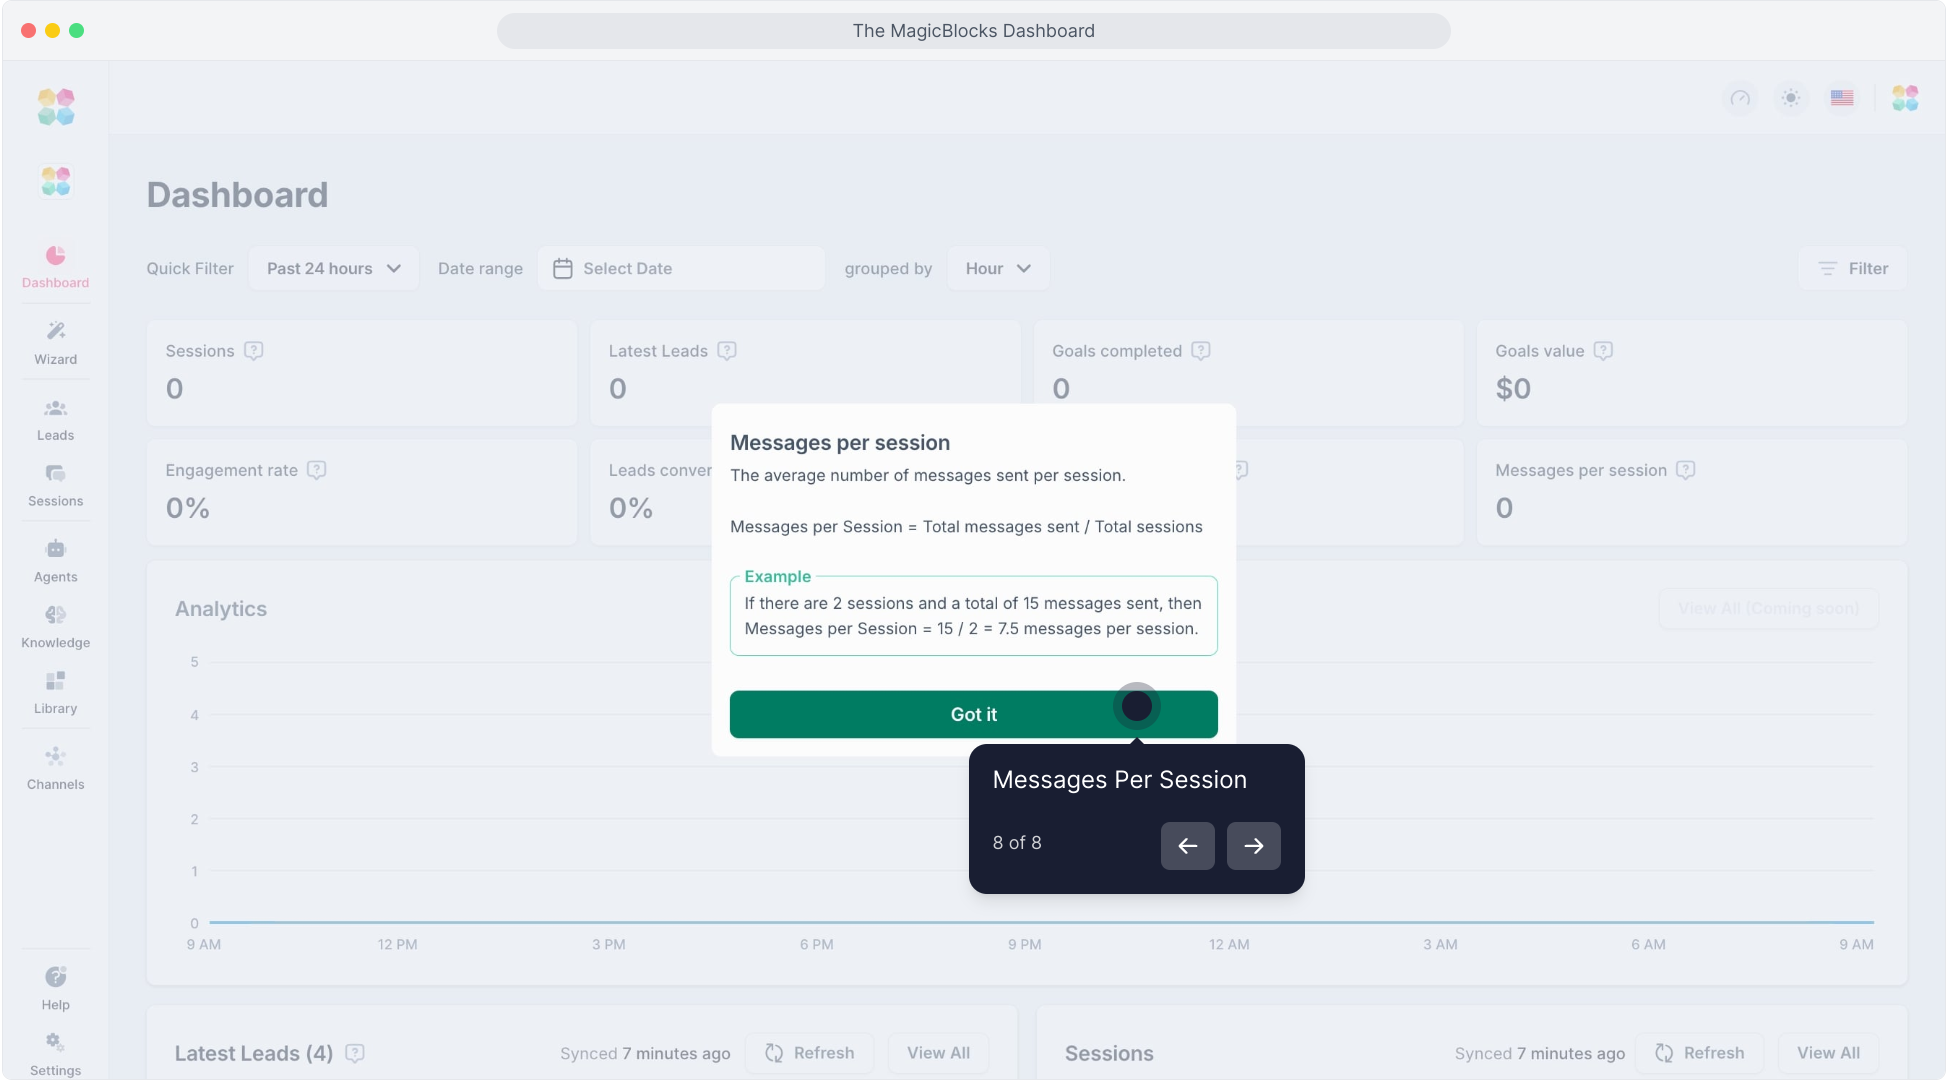
Contact Conversion Rate – The percentage of sessions that result in a qualified contact. A higher rate indicates your AI is effectively capturing and converting prospects.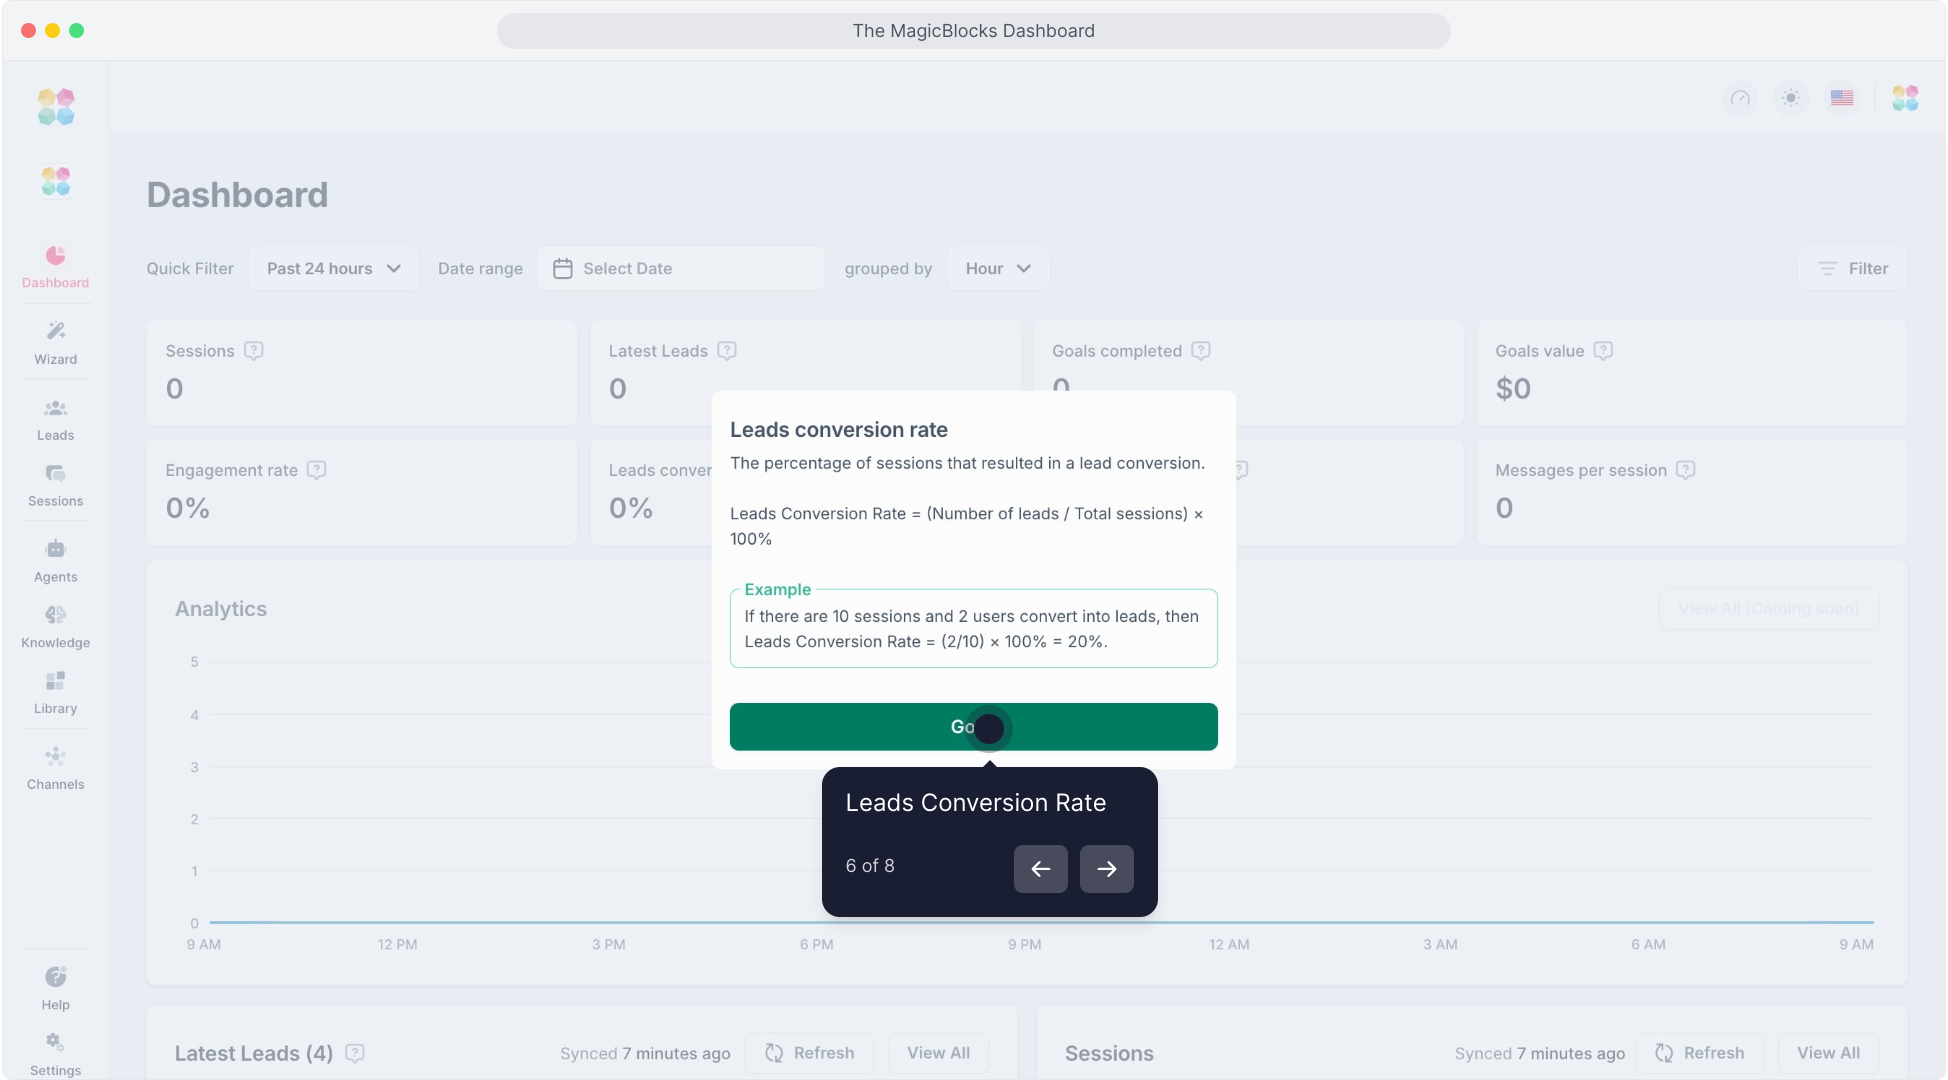
Goals Completed – The number of times users complete a primary goal.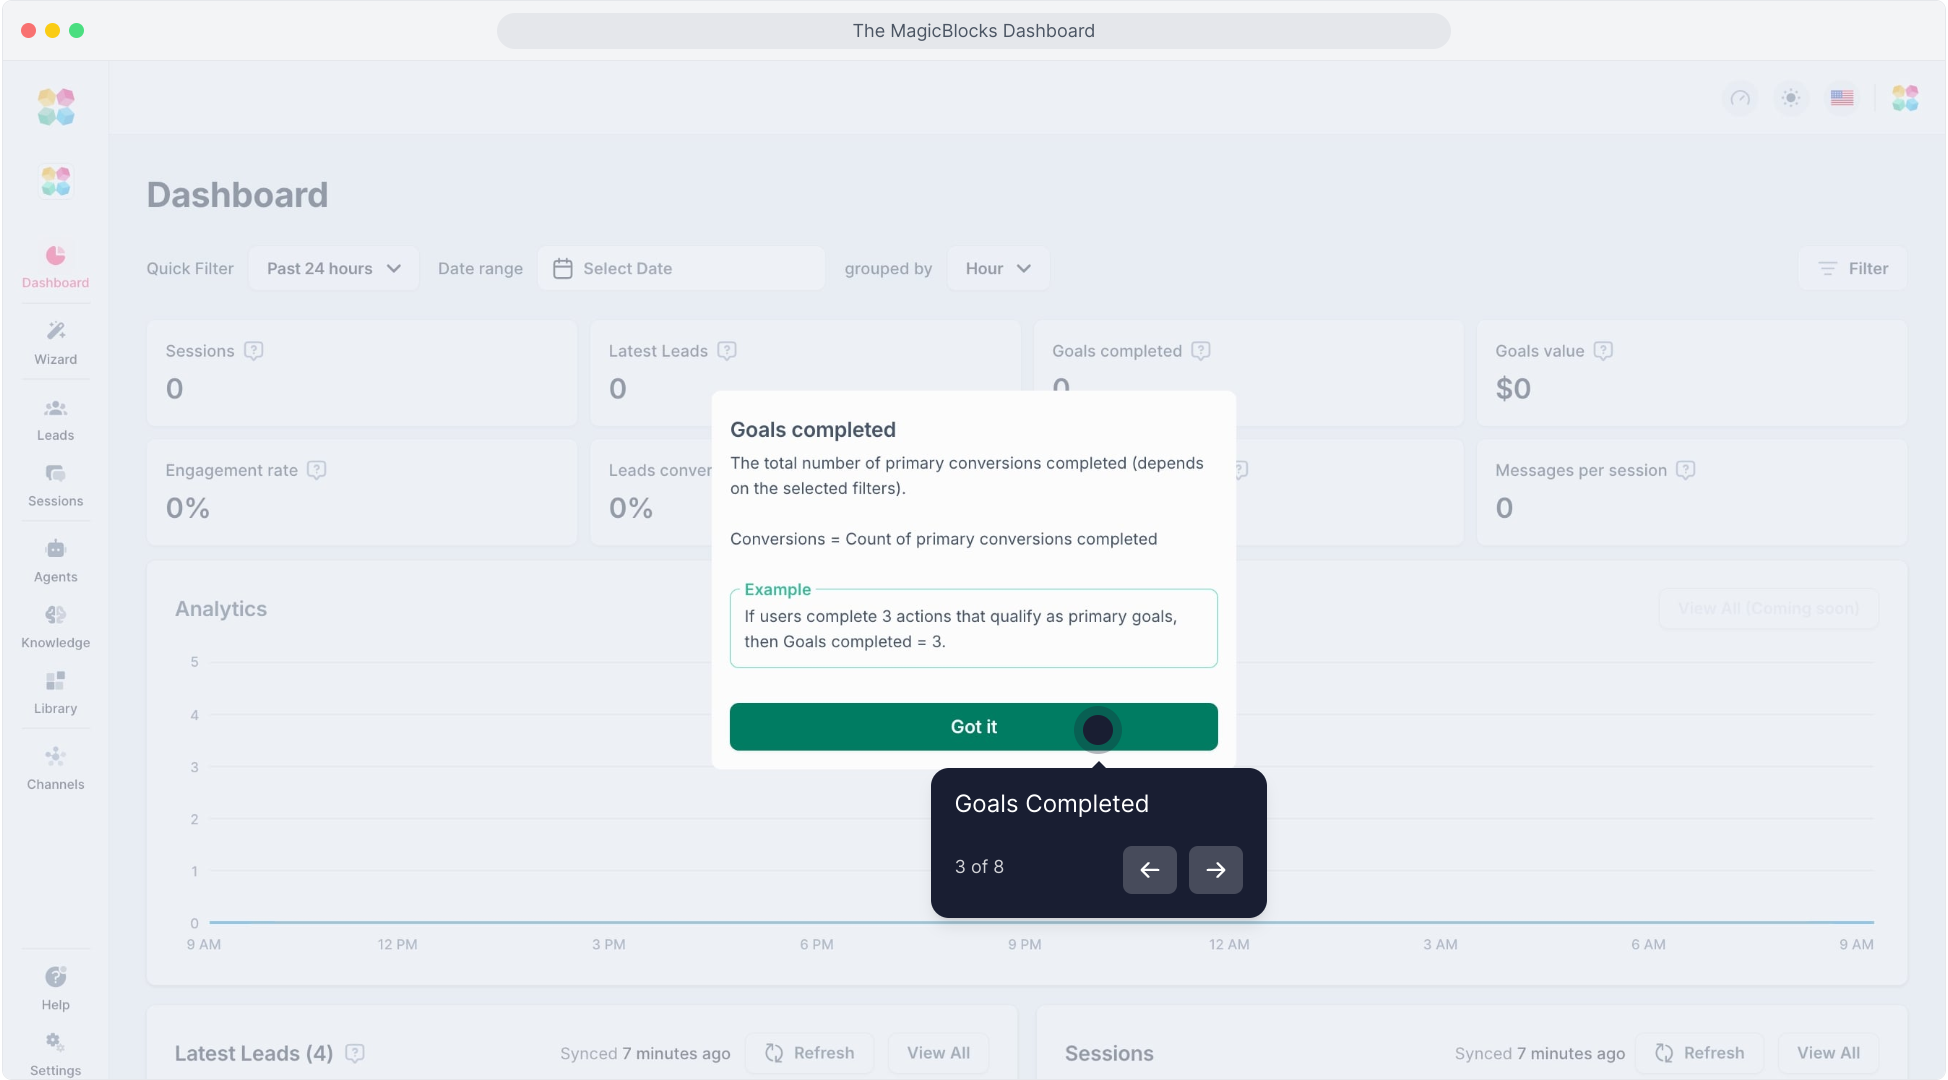
Goal Conversion Rate – The percentage of sessions that result in goal completion.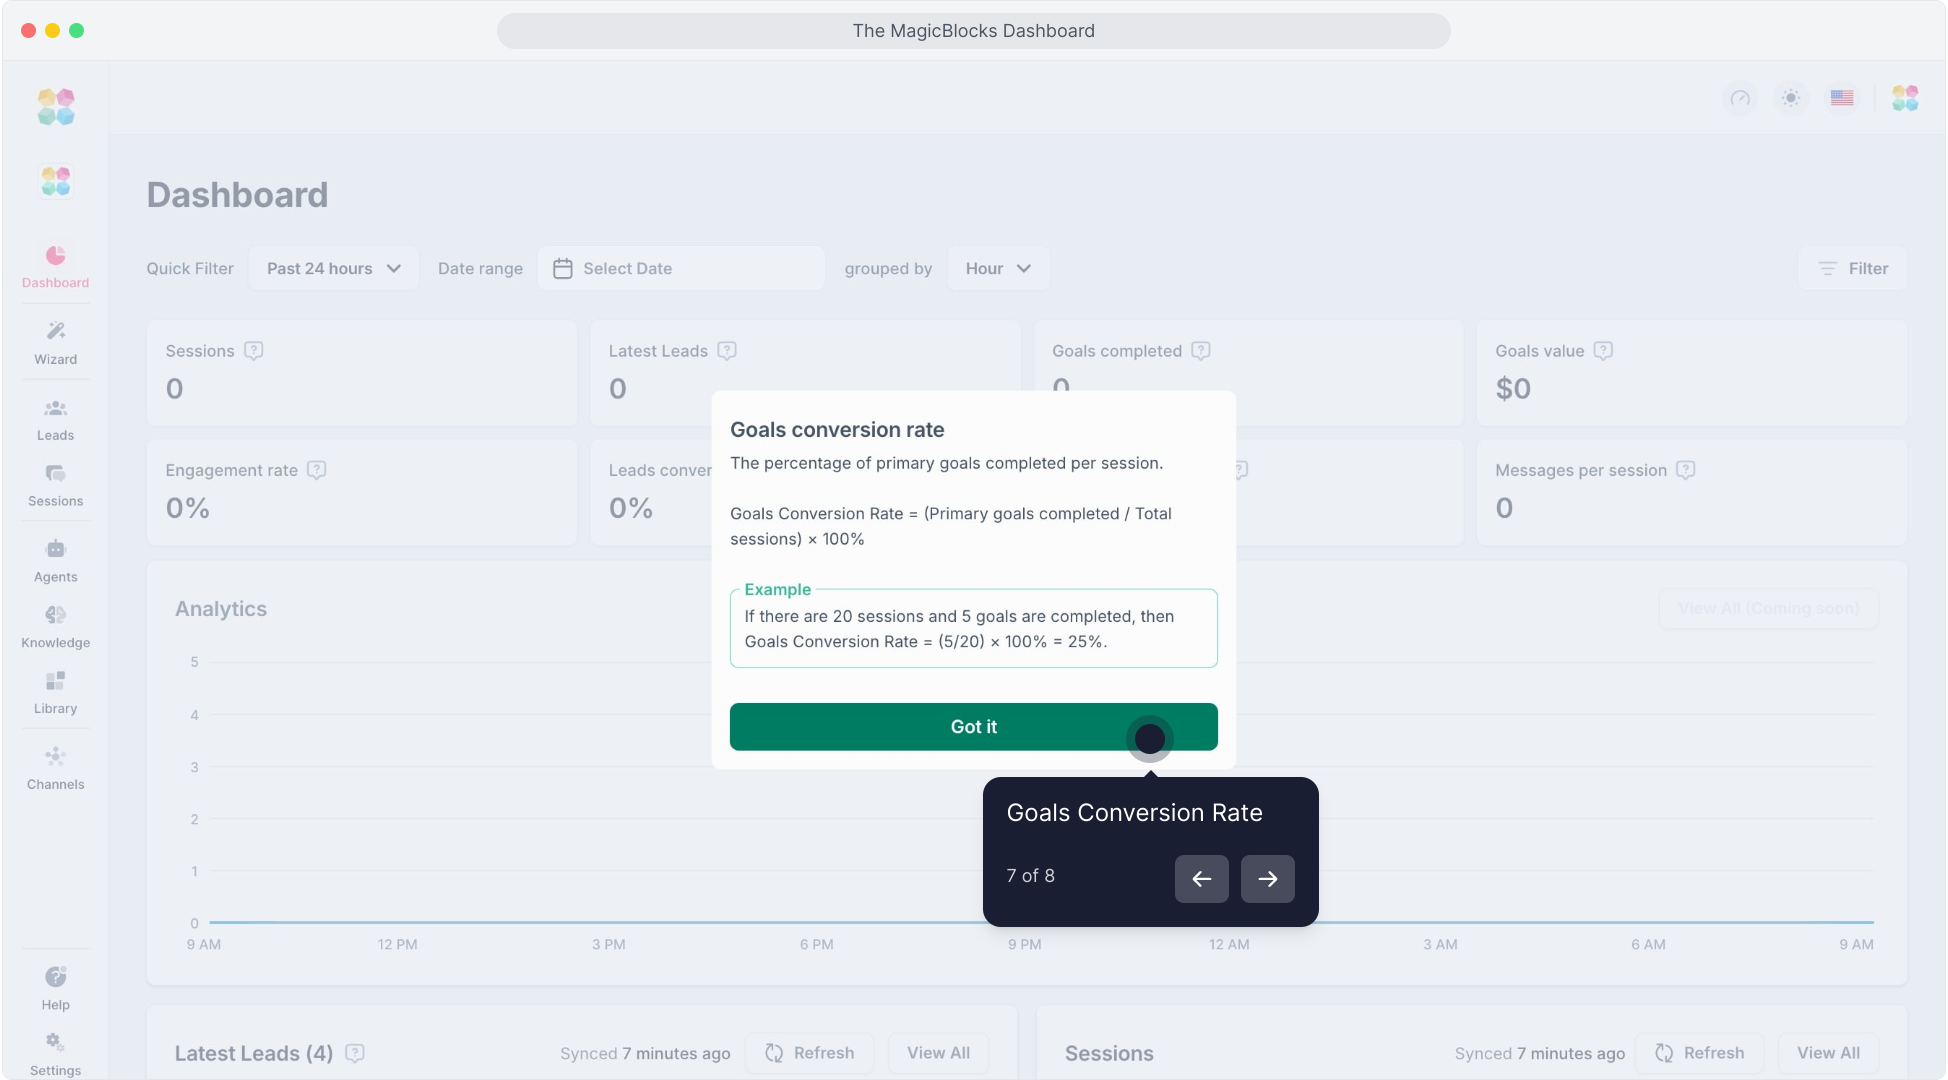
Goal Value – The total value of completed goals.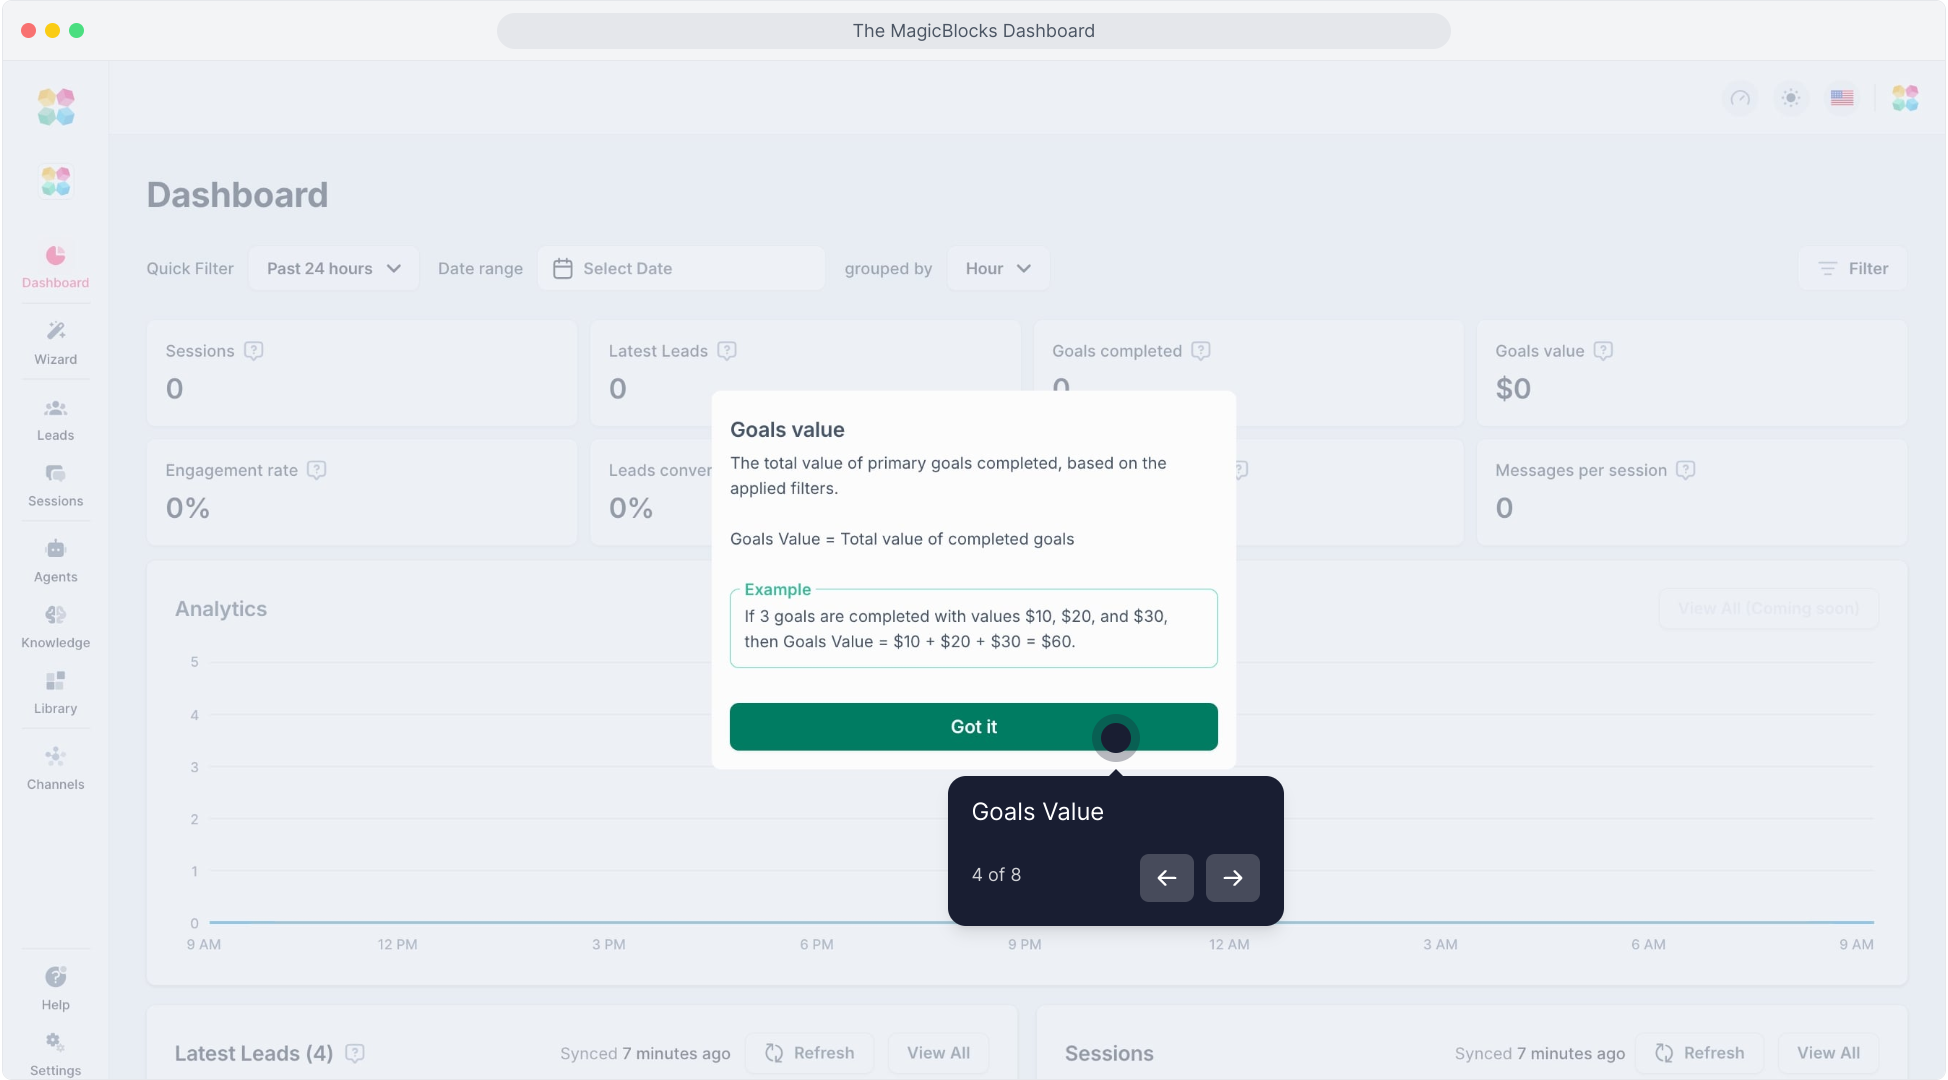
Analytics Section
The analytics graph provides a visual representation of key performance trends over a selected period. The UI allows filtering by different time ranges (e.g., past 7 days) and grouping by days for a clearer breakdown. Here’s what you can track:
Messages, Sessions, Contacts, and Conversions over time.
Identify peak engagement periods and trends in user interactions.
Detect sudden spikes or drops that might indicate changes in user behavior or system issues.
By analyzing this data, you can make data-driven improvements to optimize your AI Agent’s performance.
Latest Contacts & Sessions Overview
Latest Contacts Section
This section provides a real-time feed of the most recent contacts captured by your AI Agent. You can:
- View contact details such as email and creation timestamp.
- Sync new contacts automatically or refresh the list manually.
- Click "View All" for a more detailed breakdown of all captured contacts.
Sessions Section
The Sessions section displays real-time user interactions and allows filtering by:
- Latest – Recent conversations your AI Agent has handled.
- With Goal – Sessions where a goal was successfully completed.
- Negative – Sessions flagged for review due to potential issues.
For an in-depth review, click View All to access the full session history.
Filtering & Customizing Data
The dashboard includes a Filter button, allowing you to refine displayed data based on:
- Specific date ranges
- Grouping by day, week, or month
- Custom goal filters to track performance for specific objectives
Optimizing Your AI Agent’s Performance
To ensure your AI Agent is driving the best results, keep an eye on these key areas:
- High Engagement Rate – Indicates that users find your AI’s responses valuable.
- Strong Contact Conversion Rate – Confirms that your AI is successfully identifying and qualifying contacts.
- Goal Tracking – Regularly assess goal completion rates and values to determine if your AI Agent is effectively guiding users toward conversions.
Optimization Tips:
- Refine AI Responses – Review past sessions and adjust conversation flows to better address user needs.
- Adjust Goal Flow & Scripts – If goal conversions are low, modify the prompts and pathways leading to them.
- Analyze Drop-Off Points – Identify where users disengage and tweak conversation strategies accordingly.
Your dashboard is the command center for optimizing AI performance. Regular monitoring and adjustments will ensure your AI Agent remains effective, engaging, and aligned with your business objectives. Explore the metrics, test different strategies, and watch your AI Agent improve over time!
Related Articles
Building a High-Quality Contact Database